# Static charts (/docs/code-interpreting/create-charts-visualizations/static-charts)
Related: [Interactive charts](/docs/code-interpreting/create-charts-visualizations/interactive-charts.md), [Run bash code](/docs/code-interpreting/supported-languages/bash.md)
Every time you run Python code with `runCode()` in JavaScript or `run_code()` method in Python, the code is executed in a headless Jupyter server inside the sandbox.
E2B automatically detects any plots created with Matplotlib and sends them back to the client as images encoded in the base64 format.
These images are directly accesible on the `result` items in the `execution.results` array.
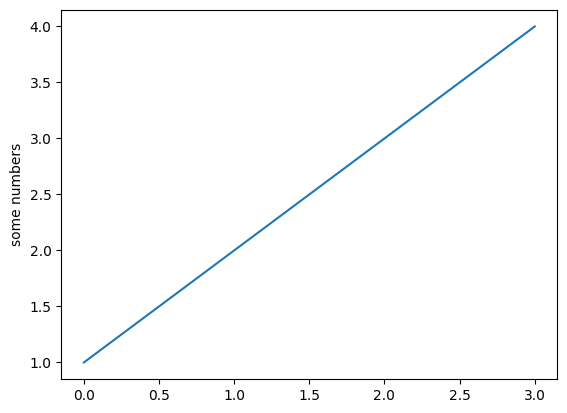
Here's how to retrieve a static chart from the executed Python code that contains a Matplotlib plot.
JavaScript & TypeScript
Python
```js
import { Sandbox } from '@e2b/code-interpreter'
import fs from 'fs'
const codeToRun = `
import matplotlib.pyplot as plt
plt.plot([1, 2, 3, 4])
plt.ylabel('some numbers')
plt.show()
`
const sandbox = await Sandbox.create()
// Run the code inside the sandbox
const execution = await sandbox.runCode(codeToRun)
// There's only one result in this case - the plot displayed with `plt.show()`
const firstResult = execution.results[0]
if (firstResult.png) {
// Save the png to a file. The png is in base64 format.
fs.writeFileSync('chart.png', firstResult.png, { encoding: 'base64' })
console.log('Chart saved as chart.png')
}
```
```python
import base64
from e2b_code_interpreter import Sandbox
code_to_run = """
import matplotlib.pyplot as plt
plt.plot([1, 2, 3, 4])
plt.ylabel('some numbers')
plt.show()
"""
sandbox = Sandbox.create()
# Run the code inside the sandbox
execution = sandbox.run_code(code_to_run)
# There's only one result in this case - the plot displayed with `plt.show()`
first_result = execution.results[0]
if first_result.png:
# Save the png to a file. The png is in base64 format.
with open('chart.png', 'wb') as f:
f.write(base64.b64decode(first_result.png))
print('Chart saved as chart.png')
```
The code in the variable `codeToRun`/`code_to_run` will produce this following plot that we're saving as `chart.png` file.