# Analyze data with AI (/docs/code-interpreting/analyze-data-with-ai)
Related: [Code contexts](/docs/code-interpreting/contexts.md), [Create charts & visualizations](/docs/code-interpreting/create-charts-visualizations.md), [Customize the template](/docs/code-interpreting/customize-template.md), [Streaming](/docs/code-interpreting/streaming.md), [Supported languages](/docs/code-interpreting/supported-languages.md), [Volumes](/docs/volumes.md)
You can use E2B Sandbox to run AI-generated code to analyze data. Here's how the AI data analysis workflow usually looks like:
1. Your user has a dataset in CSV format or other formats.
2. You prompt the LLM to generate code (usually Python) based on the user's data.
3. The sandbox runs the AI-generated code and returns the results.
4. You display the results to the user.
***
## Example: Analyze CSV file with E2B and Claude 3.5 Sonnet [#example-analyze-csv-file-with-e2b-and-claude-35-sonnet]
This short example will show you how to use E2B Sandbox to run AI-generated code to analyze CSV data.
### Table of Contents [#table-of-contents]
1. [Install dependencies](#1-install-dependencies)
2. [Set your API keys](#2-set-your-api-keys)
3. [Download example CSV file](#3-download-example-csv-file)
4. [Initialize the sandbox and upload the dataset to the sandbox](#4-initialize-the-sandbox-and-upload-the-dataset-to-the-sandbox)
5. [Prepare the method for running AI-generated code](#5-prepare-the-method-for-running-ai-generated-code)
6. [Prepare the prompt and initialize Anthropic client](#6-prepare-the-prompt-and-initialize-anthropic-client)
7. [Connect the sandbox to the LLM with tool calling](#7-connect-the-sandbox-to-the-llm-with-tool-calling)
8. [Parse the LLM response and run the AI-generated code in the sandbox](#8-parse-the-llm-response-and-run-the-ai-generated-code-in-the-sandbox)
9. [Save the generated chart](#9-save-the-generated-chart)
10. [Run the code](#10-run-the-code)
11. [Full final code](#full-final-code)
### 1. Install dependencies [#1-install-dependencies]
Install the E2B SDK and Claude SDK to your project by running the following command in your terminal.
JavaScript & TypeScript
Python
```bash
npm i @e2b/code-interpreter @anthropic-ai/sdk dotenv
```
```bash
pip install e2b-code-interpreter anthropic python-dotenv
```
### 2. Set your API keys [#2-set-your-api-keys]
1. Get your E2B API key from [E2B Dashboard](https://e2b.dev/dashboard?tab=keys).
2. Get your Claude API key from [Claude API Dashboard](https://console.anthropic.com/settings/keys).
3. Paste the keys into your `.env` file.
.env
```bash
E2B_API_KEY=e2b_***
ANTHROPIC_API_KEY=sk-ant-***
```
### 3. Download example CSV file [#3-download-example-csv-file]
{/* We'll be using the publicly available [AirBnB NYC dataset](https://www.kaggle.com/datasets/dgomonov/new-york-city-airbnb-open-data). */}
We'll be using the publicly available [dataset of about 10,000 movies](https://www.kaggle.com/datasets/muqarrishzaib/tmdb-10000-movies-dataset).
1. Click the "Download" button at the top of the page.
2. Select "Download as zip (2 MB)".
3. Unzip the file and you should see `dataset.csv` file. Move it to the root of your project.
### 4. Initialize the sandbox and upload the dataset to the sandbox [#4-initialize-the-sandbox-and-upload-the-dataset-to-the-sandbox]
We'll upload the dataset from the third step to the sandbox and save it as `dataset.csv` file.
JavaScript & TypeScript
Python
```js
import 'dotenv/config'
import fs from 'fs'
import { Sandbox } from '@e2b/code-interpreter'
// Create sandbox
const sbx = await Sandbox.create()
// Upload the dataset to the sandbox
const content = fs.readFileSync('dataset.csv')
const datasetPathInSandbox = await sbx.files.write('dataset.csv', content)
```
```python
from dotenv import load_dotenv
load_dotenv()
from e2b_code_interpreter import Sandbox
# Create sandbox
sbx = Sandbox.create()
# Upload the dataset to the sandbox
dataset_path_in_sandbox = ""
with open("dataset.csv", "rb") as f:
dataset_path_in_sandbox = sbx.files.write("dataset.csv", f)
```
### 5. Prepare the method for running AI-generated code [#5-prepare-the-method-for-running-ai-generated-code]
Add the following code to the file. Here we're adding the method for code execution.
JavaScript & TypeScript
Python
```js
// ... code from the previous step
async function runAIGeneratedCode(aiGeneratedCode: string) {
console.log('Running the code in the sandbox....')
const execution = await sbx.runCode(aiGeneratedCode)
console.log('Code execution finished!')
console.log(execution)
}
```
```python
# ... code from the previous step
def run_ai_generated_code(ai_generated_code: str):
print('Running the code in the sandbox....')
execution = sbx.run_code(ai_generated_code)
print('Code execution finished!')
print(execution)
```
### 6. Prepare the prompt and initialize Anthropic client [#6-prepare-the-prompt-and-initialize-anthropic-client]
The prompt we'll be using describes the dataset and the analysis we want to perform like this:
1. Describe the columns in the CSV dataset.
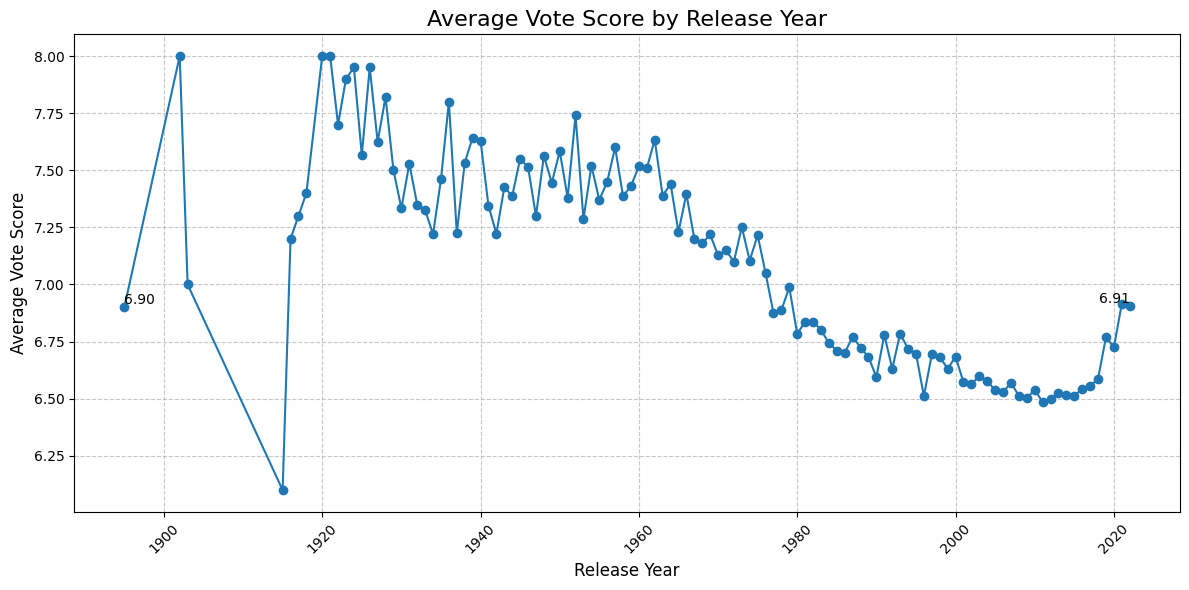
2. Ask the LLM what we want to analyze - here we want to analyze the vote average over time. We're asking for a chart as the output.
3. Instruct the LLM to generate Python code for the data analysis.
JavaScript & TypeScript
Python
```js
import Anthropic from '@anthropic-ai/sdk'
const prompt = `
I have a CSV file about movies. It has about 10k rows. It's saved in the sandbox at ${dataset_path_in_sandbox.path}.
These are the columns:
- 'id': number, id of the movie
- 'original_language': string like "eng", "es", "ko", etc
- 'original_title': string that's name of the movie in the original language
- 'overview': string about the movie
- 'popularity': float, from 0 to 9137.939. It's not normalized at all and there are outliers
- 'release_date': date in the format yyyy-mm-dd
- 'title': string that's the name of the movie in english
- 'vote_average': float number between 0 and 10 that's representing viewers voting average
- 'vote_count': int for how many viewers voted
Write Python code that creates a line chart showing how vote_average changed over the years.
Do NOT print or explore the data. Just create the visualization directly.
CRITICAL: Your code MUST end with this exact line to display the plot:
display(plt.gcf())`
const anthropic = new Anthropic()
console.log('Waiting for the model response...')
const msg = await anthropic.messages.create({
model: 'claude-haiku-4-5-20251001',
max_tokens: 1024,
messages: [{ role: 'user', content: prompt }],
})
```
```python
from anthropic import Anthropic
prompt = f'''
I have a CSV file about movies. It has about 10k rows. It's saved in the sandbox at {dataset_path_in_sandbox.path}.
These are the columns:
- 'id': number, id of the movie
- 'original_language': string like "eng", "es", "ko", etc
- 'original_title': string that's name of the movie in the original language
- 'overview': string about the movie
- 'popularity': float, from 0 to 9137.939. It's not normalized at all and there are outliers
- 'release_date': date in the format yyyy-mm-dd
- 'title': string that's the name of the movie in english
- 'vote_average': float number between 0 and 10 that's representing viewers voting average
- 'vote_count': int for how many viewers voted
Write Python code that creates a line chart showing how vote_average changed over the years.
Do NOT print or explore the data. Just create the visualization directly.
CRITICAL: Your code MUST end with this exact line to display the plot:
display(plt.gcf())'''
anthropic = Anthropic()
msg = anthropic.messages.create(
model='claude-haiku-4-5-20251001',
max_tokens=1024,
messages=[
{"role": "user", "content": prompt}
]
)
```
### 7. Connect the sandbox to the LLM with tool calling [#7-connect-the-sandbox-to-the-llm-with-tool-calling]
We'll use Claude's ability to [use tools (function calling)](https://docs.anthropic.com/en/docs/build-with-claude/tool-use) to run the code in the sandbox.
The way we'll do it is by connecting the method for running AI-generated code we created in the previous step to the Claude model.
Update the initialization of the Anthropic client to include the tool use like this:
JavaScript & TypeScript
Python
```js highlight={5-20}
const msg = await anthropic.messages.create({
model: 'claude-haiku-4-5-20251001',
max_tokens: 1024,
messages: [{ role: 'user', content: prompt }],
tools: [
{
name: 'run_python_code',
description: 'Run Python code',
input_schema: {
type: 'object',
properties: {
code: {
type: 'string',
description: 'The Python code to run',
},
},
required: ['code'],
},
},
],
})
```
```python highlight={7-19}
msg = anthropic.messages.create(
model='claude-haiku-4-5-20251001',
max_tokens=1024,
messages=[
{"role": "user", "content": prompt}
],
tools=[
{
"name": "run_python_code",
"description": "Run Python code",
"input_schema": {
"type": "object",
"properties": {
"code": { "type": "string", "description": "The Python code to run" },
},
"required": ["code"],
},
},
],
)
```
### 8. Parse the LLM response and run the AI-generated code in the sandbox [#8-parse-the-llm-response-and-run-the-ai-generated-code-in-the-sandbox]
Now we'll parse the `msg` object to get the code from the LLM's response based on the tool we created in the previous step.
Once we have the code, we'll pass it to the `runAIGeneratedCode` method in JavaScript or `run_ai_generated_code` method in Python we created in the previous step to run the code in the sandbox.
JavaScript & TypeScript
Python
```js
// ... code from the previous steps
interface CodeRunToolInput {
code: string
}
for (const contentBlock of msg.content) {
if (contentBlock.type === 'tool_use') {
if (contentBlock.name === 'run_python_code') {
const code = (contentBlock.input as CodeRunToolInput).code
console.log('Will run following code in the sandbox', code)
// Execute the code in the sandbox
await runAIGeneratedCode(code)
}
}
}
```
```python
for content_block in msg.content:
if content_block.type == 'tool_use':
if content_block.name == 'run_python_code':
code = content_block.input['code']
print('Will run following code in the sandbox', code)
# Execute the code in the sandbox
run_ai_generated_code(code)
```
### 9. Save the generated chart [#9-save-the-generated-chart]
When running code in the sandbox for data analysis, you can get different types of results.
Including stdout, stderr, charts, tables, text, runtime errors, and more.
In this example we're specifically asking for a chart so we'll be looking for the chart in the results.
Let's update the `runAIGeneratedCode` method in JavaScript and `run_ai_generated_code` method in Python to check for the chart in the results and save it to the file.
JavaScript & TypeScript
Python
```js highlight={7-13,16-18,21-25}
async function runAIGeneratedCode(aiGeneratedCode: string) {
console.log('Running the code in the sandbox....')
const execution = await sbx.runCode(aiGeneratedCode)
console.log('Code execution finished!')
// First let's check if the code ran successfully.
if (execution.error) {
console.error('AI-generated code had an error.')
console.log(execution.error.name)
console.log(execution.error.value)
console.log(execution.error.traceback)
process.exit(1)
}
// Iterate over all the results and specifically check for png files that will represent the chart.
let resultIdx = 0
for (const result of execution.results) {
if (result.png) {
// Save the png to a file
// The png is in base64 format.
fs.writeFileSync(`chart-${resultIdx}.png`, result.png, { encoding: 'base64' })
console.log(`Chart saved to chart-${resultIdx}.png`)
resultIdx++
}
}
}
```
```python highlight={1-2,7-12,15-17,20-23}
import sys
import base64
def run_ai_generated_code(ai_generated_code: str):
print('Running the code in the sandbox....')
execution = sbx.run_code(ai_generated_code)
print('Code execution finished!')
# First let's check if the code ran successfully.
if execution.error:
print('AI-generated code had an error.')
print(execution.error.name)
print(execution.error.value)
print(execution.error.traceback)
sys.exit(1)
# Iterate over all the results and specifically check for png files that will represent the chart.
result_idx = 0
for result in execution.results:
if result.png:
# Save the png to a file
# The png is in base64 format.
with open(f'chart-{result_idx}.png', 'wb') as f:
f.write(base64.b64decode(result.png))
print(f'Chart saved to chart-{result_idx}.png')
result_idx += 1
```
### 10. Run the code [#10-run-the-code]
Now you can run the whole code to see the results.
JavaScript & TypeScript
Python
```bash
npx tsx index.ts
```
```bash
python main.py
```
You should see the chart in the root of your project that will look similar to this:
 ### Full final code [#full-final-code]
Check the full code in JavaScript and Python below:
JavaScript & TypeScript
Python
```js
import 'dotenv/config'
import fs from 'fs'
import Anthropic from '@anthropic-ai/sdk'
import { Sandbox } from '@e2b/code-interpreter'
// Create sandbox
const sbx = await Sandbox.create()
// Upload the dataset to the sandbox
const content = fs.readFileSync('dataset.csv')
const datasetPathInSandbox = await sbx.files.write('/home/user/dataset.csv', content)
async function runAIGeneratedCode(aiGeneratedCode: string) {
const execution = await sbx.runCode(aiGeneratedCode)
if (execution.error) {
console.error('AI-generated code had an error.')
console.log(execution.error.name)
console.log(execution.error.value)
console.log(execution.error.traceback)
process.exit(1)
}
// Iterate over all the results and specifically check for png files that will represent the chart.
let resultIdx = 0
for (const result of execution.results) {
if (result.png) {
// Save the png to a file
// The png is in base64 format.
fs.writeFileSync(`chart-${resultIdx}.png`, result.png, { encoding: 'base64' })
console.log(`Chart saved to chart-${resultIdx}.png`)
resultIdx++
}
}
}
const prompt = `
I have a CSV file about movies. It has about 10k rows. It's saved in the sandbox at ${dataset_path_in_sandbox.path}.
These are the columns:
- 'id': number, id of the movie
- 'original_language': string like "eng", "es", "ko", etc
- 'original_title': string that's name of the movie in the original language
- 'overview': string about the movie
- 'popularity': float, from 0 to 9137.939. It's not normalized at all and there are outliers
- 'release_date': date in the format yyyy-mm-dd
- 'title': string that's the name of the movie in english
- 'vote_average': float number between 0 and 10 that's representing viewers voting average
- 'vote_count': int for how many viewers voted
Write Python code that creates a line chart showing how vote_average changed over the years.
Do NOT print or explore the data. Just create the visualization directly.
CRITICAL: Your code MUST end with this exact line to display the plot:
display(plt.gcf())`
const anthropic = new Anthropic()
console.log('Waiting for the model response...')
const msg = await anthropic.messages.create({
model: 'claude-haiku-4-5-20251001',
max_tokens: 1024,
messages: [{ role: 'user', content: prompt }],
tools: [
{
name: 'run_python_code',
description: 'Run Python code',
input_schema: {
type: 'object',
properties: {
code: {
type: 'string',
description: 'The Python code to run',
},
},
required: ['code'],
},
},
],
})
interface CodeRunToolInput {
code: string
}
for (const contentBlock of msg.content) {
if (contentBlock.type === 'tool_use') {
if (contentBlock.name === 'run_python_code') {
const code = (contentBlock.input as CodeRunToolInput).code
console.log('Will run following code in the sandbox', code)
// Execute the code in the sandbox
await runAIGeneratedCode(code)
}
}
}
```
```python
import sys
import base64
from dotenv import load_dotenv
load_dotenv()
from e2b_code_interpreter import Sandbox
from anthropic import Anthropic
# Create sandbox
sbx = Sandbox.create()
# Upload the dataset to the sandbox
with open("../dataset.csv", "rb") as f:
dataset_path_in_sandbox = sbx.files.write("dataset.csv", f)
def run_ai_generated_code(ai_generated_code: str):
print('Running the code in the sandbox....')
execution = sbx.run_code(ai_generated_code)
print('Code execution finished!')
# First let's check if the code ran successfully.
if execution.error:
print('AI-generated code had an error.')
print(execution.error.name)
print(execution.error.value)
print(execution.error.traceback)
sys.exit(1)
# Iterate over all the results and specifically check for png files that will represent the chart.
result_idx = 0
for result in execution.results:
if result.png:
# Save the png to a file
# The png is in base64 format.
with open(f'chart-{result_idx}.png', 'wb') as f:
f.write(base64.b64decode(result.png))
print(f'Chart saved to chart-{result_idx}.png')
result_idx += 1
prompt = f"""
I have a CSV file about movies. It has about 10k rows. It's saved in the sandbox at {dataset_path_in_sandbox.path}.
These are the columns:
- 'id': number, id of the movie
- 'original_language': string like "eng", "es", "ko", etc
- 'original_title': string that's name of the movie in the original language
- 'overview': string about the movie
- 'popularity': float, from 0 to 9137.939. It's not normalized at all and there are outliers
- 'release_date': date in the format yyyy-mm-dd
- 'title': string that's the name of the movie in english
- 'vote_average': float number between 0 and 10 that's representing viewers voting average
- 'vote_count': int for how many viewers voted
Write Python code that creates a line chart showing how vote_average changed over the years.
Do NOT print or explore the data. Just create the visualization directly.
CRITICAL: Your code MUST end with this exact line to display the plot:
display(plt.gcf())"""
anthropic = Anthropic()
print("Waiting for model response...")
msg = anthropic.messages.create(
model='claude-haiku-4-5-20251001',
max_tokens=1024,
messages=[
{"role": "user", "content": prompt}
],
tools=[
{
"name": "run_python_code",
"description": "Run Python code",
"input_schema": {
"type": "object",
"properties": {
"code": { "type": "string", "description": "The Python code to run" },
},
"required": ["code"]
}
}
]
)
for content_block in msg.content:
if content_block.type == "tool_use":
if content_block.name == "run_python_code":
code = content_block.input["code"]
print("Will run following code in the sandbox", code)
# Execute the code in the sandbox
run_ai_generated_code(code)
```
### Full final code [#full-final-code]
Check the full code in JavaScript and Python below:
JavaScript & TypeScript
Python
```js
import 'dotenv/config'
import fs from 'fs'
import Anthropic from '@anthropic-ai/sdk'
import { Sandbox } from '@e2b/code-interpreter'
// Create sandbox
const sbx = await Sandbox.create()
// Upload the dataset to the sandbox
const content = fs.readFileSync('dataset.csv')
const datasetPathInSandbox = await sbx.files.write('/home/user/dataset.csv', content)
async function runAIGeneratedCode(aiGeneratedCode: string) {
const execution = await sbx.runCode(aiGeneratedCode)
if (execution.error) {
console.error('AI-generated code had an error.')
console.log(execution.error.name)
console.log(execution.error.value)
console.log(execution.error.traceback)
process.exit(1)
}
// Iterate over all the results and specifically check for png files that will represent the chart.
let resultIdx = 0
for (const result of execution.results) {
if (result.png) {
// Save the png to a file
// The png is in base64 format.
fs.writeFileSync(`chart-${resultIdx}.png`, result.png, { encoding: 'base64' })
console.log(`Chart saved to chart-${resultIdx}.png`)
resultIdx++
}
}
}
const prompt = `
I have a CSV file about movies. It has about 10k rows. It's saved in the sandbox at ${dataset_path_in_sandbox.path}.
These are the columns:
- 'id': number, id of the movie
- 'original_language': string like "eng", "es", "ko", etc
- 'original_title': string that's name of the movie in the original language
- 'overview': string about the movie
- 'popularity': float, from 0 to 9137.939. It's not normalized at all and there are outliers
- 'release_date': date in the format yyyy-mm-dd
- 'title': string that's the name of the movie in english
- 'vote_average': float number between 0 and 10 that's representing viewers voting average
- 'vote_count': int for how many viewers voted
Write Python code that creates a line chart showing how vote_average changed over the years.
Do NOT print or explore the data. Just create the visualization directly.
CRITICAL: Your code MUST end with this exact line to display the plot:
display(plt.gcf())`
const anthropic = new Anthropic()
console.log('Waiting for the model response...')
const msg = await anthropic.messages.create({
model: 'claude-haiku-4-5-20251001',
max_tokens: 1024,
messages: [{ role: 'user', content: prompt }],
tools: [
{
name: 'run_python_code',
description: 'Run Python code',
input_schema: {
type: 'object',
properties: {
code: {
type: 'string',
description: 'The Python code to run',
},
},
required: ['code'],
},
},
],
})
interface CodeRunToolInput {
code: string
}
for (const contentBlock of msg.content) {
if (contentBlock.type === 'tool_use') {
if (contentBlock.name === 'run_python_code') {
const code = (contentBlock.input as CodeRunToolInput).code
console.log('Will run following code in the sandbox', code)
// Execute the code in the sandbox
await runAIGeneratedCode(code)
}
}
}
```
```python
import sys
import base64
from dotenv import load_dotenv
load_dotenv()
from e2b_code_interpreter import Sandbox
from anthropic import Anthropic
# Create sandbox
sbx = Sandbox.create()
# Upload the dataset to the sandbox
with open("../dataset.csv", "rb") as f:
dataset_path_in_sandbox = sbx.files.write("dataset.csv", f)
def run_ai_generated_code(ai_generated_code: str):
print('Running the code in the sandbox....')
execution = sbx.run_code(ai_generated_code)
print('Code execution finished!')
# First let's check if the code ran successfully.
if execution.error:
print('AI-generated code had an error.')
print(execution.error.name)
print(execution.error.value)
print(execution.error.traceback)
sys.exit(1)
# Iterate over all the results and specifically check for png files that will represent the chart.
result_idx = 0
for result in execution.results:
if result.png:
# Save the png to a file
# The png is in base64 format.
with open(f'chart-{result_idx}.png', 'wb') as f:
f.write(base64.b64decode(result.png))
print(f'Chart saved to chart-{result_idx}.png')
result_idx += 1
prompt = f"""
I have a CSV file about movies. It has about 10k rows. It's saved in the sandbox at {dataset_path_in_sandbox.path}.
These are the columns:
- 'id': number, id of the movie
- 'original_language': string like "eng", "es", "ko", etc
- 'original_title': string that's name of the movie in the original language
- 'overview': string about the movie
- 'popularity': float, from 0 to 9137.939. It's not normalized at all and there are outliers
- 'release_date': date in the format yyyy-mm-dd
- 'title': string that's the name of the movie in english
- 'vote_average': float number between 0 and 10 that's representing viewers voting average
- 'vote_count': int for how many viewers voted
Write Python code that creates a line chart showing how vote_average changed over the years.
Do NOT print or explore the data. Just create the visualization directly.
CRITICAL: Your code MUST end with this exact line to display the plot:
display(plt.gcf())"""
anthropic = Anthropic()
print("Waiting for model response...")
msg = anthropic.messages.create(
model='claude-haiku-4-5-20251001',
max_tokens=1024,
messages=[
{"role": "user", "content": prompt}
],
tools=[
{
"name": "run_python_code",
"description": "Run Python code",
"input_schema": {
"type": "object",
"properties": {
"code": { "type": "string", "description": "The Python code to run" },
},
"required": ["code"]
}
}
]
)
for content_block in msg.content:
if content_block.type == "tool_use":
if content_block.name == "run_python_code":
code = content_block.input["code"]
print("Will run following code in the sandbox", code)
# Execute the code in the sandbox
run_ai_generated_code(code)
```